Environmental Data Tracking
The Trust Protocol is committed to driving continuous improvement in the production of U.S. Cotton through transparent, verifiable data. Our goal is to maintain our position as an established, credible framework where the field-level environmental impact is measured and verified, ultimately envisioning a future where all U.S. Cotton is recognized as sustainably grown.
By aligning with ambitious goals and rigorously tracking progress, we empower Protocol growers to make informed decisions that benefit both the environment and their operation. The Trust Protocol serves as a vital catalyst for change, providing a framework for data collection and analysis. This data fuels innovation, informs best practices, and drives progress.
Robust Data from the Field
The Trust Protocol provides farm-level data via Field to Market, measured by the Fieldprint Calculator, and third-party verified. This rigorous, multi-stage data collection and verification process begins with growers voluntarily sharing information about their sustainable farming practices. We track progress across six key metrics, providing a comprehensive view of the environmental impact of U.S. Cotton production:
- Water Use: Measuring water consumption and efficiency to minimize depletion of precious water resources.
- Yield and Land Use: Analyzing land management practices to protect biodiversity and promote healthy ecosystems.
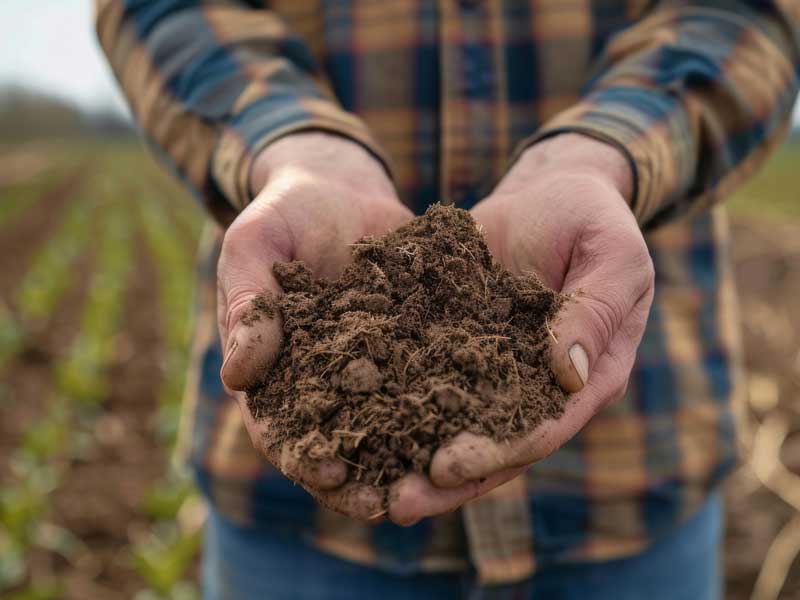
- Soil Carbon: Monitoring soil health and carbon sequestration to enhance soil fertility and improve environmental sustainability.
- Soil Conservation: Tracking erosion rates to preserve topsoil and maintain productive farmland.
- Emissions: Quantifying emissions to identify opportunities for reduction and contribute to a lower environmental impact.
- Energy Use: Measuring energy consumption to improve efficiency and reduce reliance on fossil fuels.
Key Progress
Trust Protocol growers have met or exceeded 5 out of 6 of the ambitious 2025 National Goals set against the 2015 baseline.
In our 2024/25 Annual Report we saw:


The 2024/25 growing season also reveals how Protocol growers are increasingly adopting regenerative agriculture practices, leading to measurable improvements to soil health, water quality, and biodiversity across U.S. cotton farms.
A majority of Protocol growers (63%) are planting cover crops to maintain living roots in the soil, resulting in a 300% higher Soil Conditioning Index and nearly half the erosion compared to bare-soil fields.
More Protocol growers are minimizing soil disturbance, with 57% of acres now under no-till or conservation tillage (up from 51% in 2020/21), leading to lower erosion, better water infiltration, and reduced fuel use.
Most Protocol growers (77%) are maximizing diversity through crop rotation, reducing erosion by an average of 21% and disrupting pest cycles.
Most Protocol growers (87%) are implementing Integrated Pest Management (IPM) strategies, reducing pesticide use while protecting yields and farm profitability.
The majority of Protocol growers (84%) are following 4R nutrient management principles, reducing nitrous oxide emissions, improving water quality, and enhancing nutrient-use efficiency.
Protocol growers are supporting biodiversity, with over 63% achieving habitat scores aboce national benchmarks, reflecting the integration of pollinator strips, corridors, wetlands, and native plantings.
Farming is becoming increasingly data-driven as the industry has shifted to using verified information to drive sustainable decision making. We use the data we receive from the Trust Protocol to track measurable sustainability outcomes and constantly improve. We take the feedback from the Trust Protocol, along with historical analytics we compile with meteorological data, that allows us to make more informed crop management decisions.
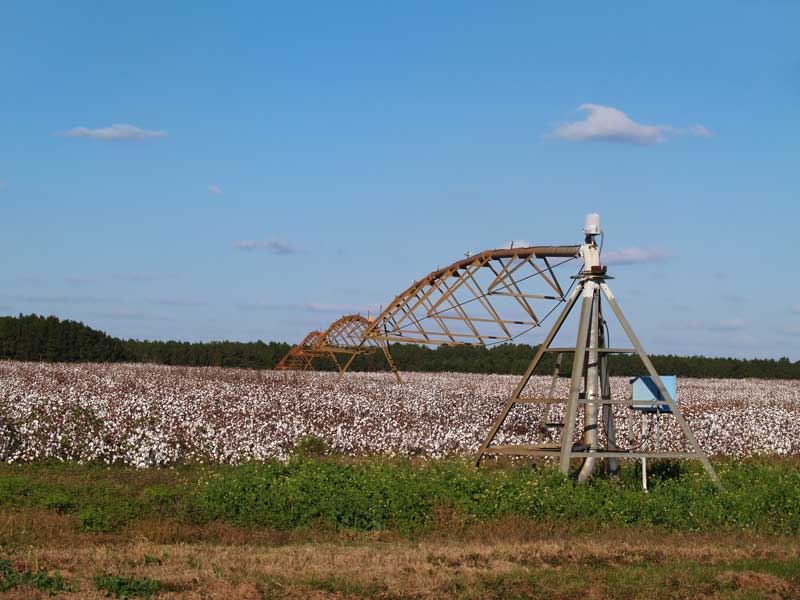
For example, we combine this data with our drip irrigation plan to prevent overwatering – so we make the most of every drop. From this, we’ve seen an 80% reduction in our water usage compared to conventional irrigation.
We take pride in our innovative approach to adopting the latest technology, such as precision agriculture systems, irrigation monitoring and GPS mapping to maximize the efficiency and sustainability of our operations.
Lamont Bridgeforth, Alabama
Visit our 2025 Annual Report to learn more about our important work to date.
More About What We Offer
Supply Chain Traceability
Trace your cotton's journey to the finished product with our traceability system. Gain unparalleled visibility into your supply chain and build consumer trust.
Responsible Cotton Production
Discover how the U.S. Cotton Trust Protocol supports growers in implementing sustainable practices that protect the environment and empower communities.